What drives GMT price?
It is easy to look at Bitcoin and assume GMT simply follows the broader crypto market.
But GMT is different.
GMT sits at the center of the GoMining ecosystem. It is used across the ecosystem for fees, miners, upgrades, locking and other forms of utility.
So how much of GMT’s price movement can we actually explain with data?
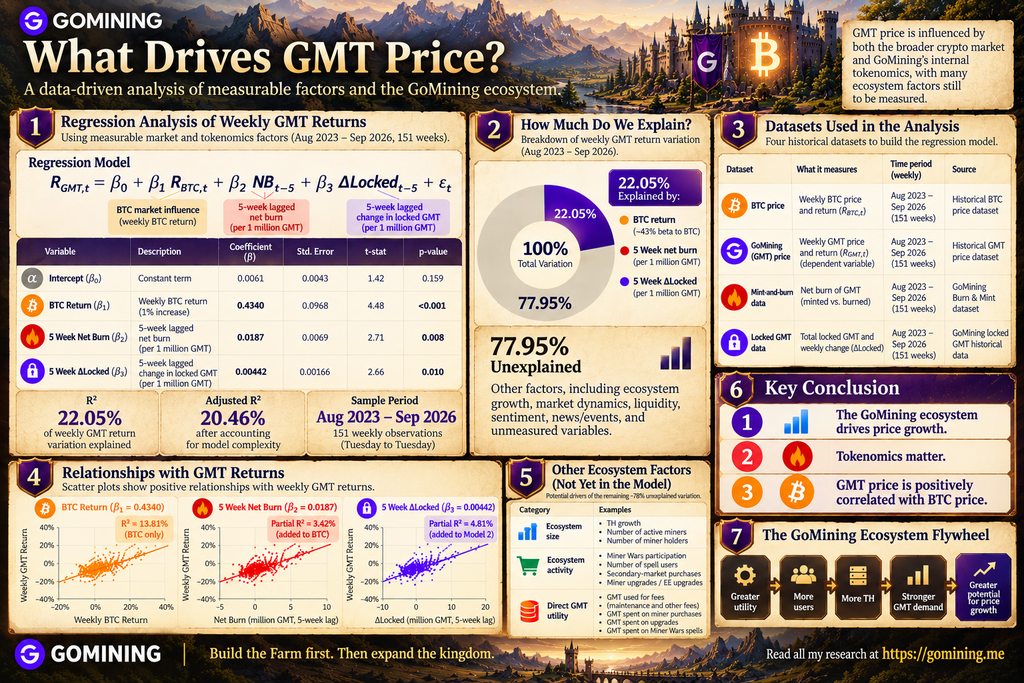
I built a weekly regression model using historical BTC price, GOMINING price, GoMining Mint-and-Burn data, and historical locked GMT data from August 2023 through September 2026.
The result is revealing.
The model
The model uses three measurable factors:
- Weekly BTC return
- 5-week lagged net burn
- 5-week lagged change in locked GMT
The model explains 22.05% of weekly GMT return variation, with an adjusted R² of 20.46%.
That leaves roughly 78% unexplained by these three measurable variables.
And that unexplained portion is important.
It does not mean that 78% is simply random. It includes ecosystem growth, user activity, liquidity, market sentiment, news, and other factors for which we do not yet have reliable historical datasets.
What drives GMT price: The GoMining ecosystem
1. The GoMining ecosystem drives price growth
The most important point is that GMT should not be viewed in isolation from the GoMining ecosystem.
GMT is the economic engine connecting many parts of the ecosystem.
Greater utility can attract more users. More users can support more mining power. More mining activity can create more demand for ecosystem services—and ultimately more demand for GMT.
This creates a potential ecosystem flywheel:
Greater utility → more users → more TH → stronger GMT demand → greater potential for price growth
We have not yet been able to quantify every link in that chain.
But the economic logic is important.
GMT’s value is connected to the activity and utility generated by the ecosystem around it.
2. What drives GMT Price: Tokenomics matter
The model finds statistically significant relationships between GMT returns and two tokenomics variables.
Net burn
The coefficient on 5-week lagged net burn is 0.0187 per million GMT.
In practical terms:
An additional 1 million GMT of net burn is associated with approximately 1.87 percentage points of higher GMT return, holding the other variables constant.
The relationship is statistically significant, with a p-value of 0.008.
The five-week lag is also interesting.
The market does not appear to respond instantaneously to the burn data. Among the weekly lags tested, five weeks produced the strongest relationship.
Locked GMT
The second tokenomics variable is the 5-week lagged change in locked GMT.
Its coefficient is 0.00442 per million GMT.
That means:
An additional 1 million GMT increase in the lagged change in locked GMT is associated with approximately 0.442 percentage points of higher GMT return, holding the other variables constant.
This relationship is also statistically significant, with a p-value of 0.010.
Locking therefore appears to contain information beyond the effect of net burn alone.
That matters because GMT demand is not only about how much supply is destroyed.
Locking activity itself appears to matter.
3. GMT price is positively correlated with BTC price
Bitcoin remains an important part of the picture.
The BTC coefficient is 0.4340.
In other words:
A 1% weekly increase in BTC is associated with approximately a 0.434% increase in GMT, holding the other variables constant.
The BTC coefficient is highly statistically significant, with a p-value below 0.001.
This is consistent with the idea that GMT remains exposed to the broader crypto market.
But the relationship is clearly not one-to-one.
A 10% move in BTC does not mechanically mean a 10% move in GMT.
GMT has its own internal economics.
What does the model explain?
The model produces:
R²: 22.05%
Adjusted R²: 20.46%
So the three measurable factors explain about one-fifth of weekly GMT return variation.
The remaining 77.95% is not something we should simply call “ecosystem growth.”
It represents everything our current model does not capture.
That includes potential factors such as:
- TH growth
- Number of active miners
- Number of miner holders
- Miner Wars participation
- Number of spell users
- Secondary-market miner purchases
- Secondary-market GoMiner purchases
- Miner and EE upgrades
- GMT used for fees
- GMT spent on miners
- GMT spent on upgrades
- GMT spent on Miner Wars
- Liquidity and trading activity
- Broader crypto-market sentiment
- News and other market events
These factors are not yet part of the regression because we do not currently have sufficiently reliable historical datasets covering them.
That is a limitation—but also an opportunity for further research.
The data behind the analysis
The regression uses four historical datasets:
| Dataset | What it measures |
|---|---|
| BTC price | Weekly Bitcoin price and returns |
| GoMining price | Weekly GMT price and returns |
| Mint-and-Burn data | Net GMT burn: GMT minted versus burned |
| Locked GMT data | Total GMT locked and weekly change in locked GMT |
The analysis covers August 2023 to September 2026, using 151 weekly Tuesday-to-Tuesday observations.
The model is deliberately simple.
Rather than throwing every conceivable variable into one regression, the objective is to identify measurable relationships first—and then expand the analysis as better historical ecosystem data becomes available.
The bigger picture
The current evidence points to three layers behind GMT price.
First: the GoMining ecosystem.
GMT is used throughout the ecosystem. Greater utility can support more users, more mining activity and greater demand for GMT.
Second: tokenomics.
Burning GMT reduces supply, while locking GMT removes tokens from circulating availability and reflects demand for participation in the ecosystem.
Third: Bitcoin.
GoMining ultimately operates around Bitcoin mining, so GMT remains positively exposed to BTC and the broader crypto market.
The data supports all three.
Conclusion
The answer to what drives GMT price is more complicated than simply saying:
“Bitcoin goes up, GMT goes up.”
Our current evidence points to three key conclusions:
1. The GoMining ecosystem drives price growth
GMT’s value is connected to the utility, adoption and economic activity of the ecosystem around it.
2. Tokenomics matter
Net burn and changes in locked GMT both show statistically significant relationships with subsequent GMT returns.
3. GMT price is positively correlated with BTC price
Bitcoin remains an important external driver, but GMT does not simply mirror BTC.
The next step is to measure the ecosystem itself.
If we can obtain reliable historical data for TH growth, Miner Wars activity, marketplace transactions, upgrades and GMT spending, we can begin explaining more of the variation in GMT price.
And that may ultimately reveal the most important relationship of all:
GMT’s utility and the growth of the GoMining ecosystem are deeply connected.
Leave a Reply