This GoMining TH and GMT strategy tests a simple question: if you have $10,000 to invest, should you put everything into TH?
More TH means more mining power. More mining power means more Bitcoin. So at first glance, putting the entire $10,000 into TH seems like the obvious strategy.
But TH does not operate for free.
Every additional TH also increases OPEX. Without a support system, some of the Bitcoin you mine eventually has to be used to keep the miner running.
I wanted to see how important that trade-off actually is.
So I ran a four-year Monte Carlo simulation comparing ten different ways of allocating the same $10,000 between GoMining TH and locked GMT. No additional capital was allowed after Day 1.
The result surprised me:
100% TH produced the lowest median terminal wealth of every allocation tested.
The reason wasn’t that TH failed to produce Bitcoin. It was that TH also created an OPEX liability that had to be supported.
This is the central idea behind my Build the Farm strategy:
TH produces. GMT supports. The objective is to build enough support around your TH that you can keep more of the Bitcoin you mine.
GoMining TH and GMT Strategy: The $10,000 Experiment
The experiment starts with exactly $10,000.
I tested ten allocations:
100/0, 90/10, 80/20, 70/30, 60/40, 50/50, 40/60, 30/70, 20/80 and 10/90 between TH and GMT.
There are three important rules.
First, no additional capital is allowed.
There is no external money coming in later to pay OPEX.
Second, all GMT purchased on Day 1 is locked.
The lock is modeled at the maximum four-year duration and continuously extended to maintain maximum voting power.
Third, when GMT rewards cannot support OPEX, the miner has to use BTC.
That last rule is crucial.
It means every strategy has to support itself.
Starting Assumptions
The simulation uses:
- Initial capital: $10,000
- Starting BTC price: $84,000
- Starting GMT price: $0.37
- Miner efficiency: 12 W/TH
- TH purchase price: $18.99/TH
- Electricity: $0.05/kWh
- Service fee: $0.0089/TH/day
- Simulation horizon: 208 weeks / 4 years
- Monte Carlo paths: 50,000
At $18.99/TH, investing the entire $10,000 into TH buys:
526.59 TH
At the other extreme, every $1,000 moved from TH into GMT buys approximately:
2,703 GMT at $0.37/GMT.
This creates the trade-off I wanted to measure.
More TH gives you more productive mining power.
More GMT gives that mining power a stronger support system.
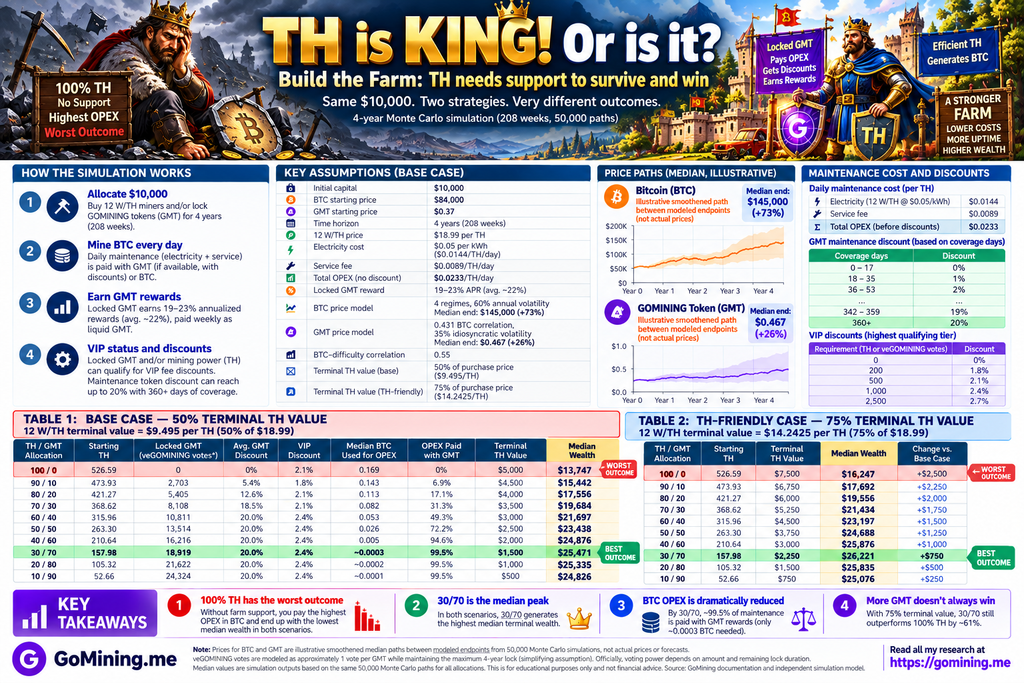
How OPEX Affects the GoMining TH and GMT Strategy
A 12 W/TH miner consumes:
12 × 24 ÷ 1,000 × $0.05 = $0.0144 per TH/day
Adding the service fee:
$0.0144 + $0.0089 = $0.0233 per TH/day
So 526.59 TH doesn’t just give the 100% TH strategy the largest mining engine.
It also gives it the largest operating bill.
This is an important distinction.
TH is not simply an asset that produces BTC.
Every additional TH also carries an ongoing electricity and maintenance obligation.
GoMining’s own documentation describes daily net mining rewards as the pool reward minus electricity and service costs after applicable discounts.
How GMT Supports the Farm
GMT plays two different roles in this simulation.
The first is reducing OPEX.
The second is helping pay OPEX.
These are not the same thing.
GMT Maintenance Discounts
GoMining allows maintenance discounts of up to 20% when maintenance is paid using GOMINING tokens. The discount depends on how many days of maintenance the wallet balance plus locked tokens can cover.
The schedule begins:
0–17 days = 0%
18–35 days = 1%
36–53 days = 2%
It continues increasing until:
360+ days = 20%
This is one reason the relationship isn’t simply:
More TH = better.
As GMT allocation rises, the farm’s operating cost can fall.
Locked GMT Rewards
The second part is the locked GMT itself.
GoMining’s veGOMINING system distributes weekly GOMINING rewards to vote holders. Officially, the amount received depends on the holder’s proportion of total system voting power.
For this simulation, I simplify that mechanism.
I assume the annualized reward fluctuates between:
19% and 23%, averaging approximately 22%.
These rewards arrive as liquid GMT and can therefore be used to support future OPEX.
This 19–23% range is a simulation assumption. It is not a guaranteed future GoMining APR.
That distinction matters because the locked GMT itself isn’t being consumed.
Think of it this way:
Locked GMT = farm infrastructure.
Liquid GMT rewards = cash flow generated by that infrastructure.
The GoMining TH and GMT Strategy Also Includes VIP Discounts
Locked GMT can generate veGOMINING votes, while TH itself can also qualify an account for VIP status. GoMining states that VIP status can be increased through mining power or veGOMINING votes, with maintenance discounts among the available benefits.
For modeling purposes, I approximate:
1 GMT locked at the maximum four-year duration ≈ 1 veGOMINING vote.
This is another simplifying assumption.
Actual voting power depends on both the amount locked and the remaining lock duration. GoMining’s documentation also notes that voting power declines over time unless the lock is extended.
The simulation therefore assumes the maximum lock is continuously maintained.
What Happens When the Farm Cannot Pay OPEX With GMT?
This is where the experiment becomes interesting.
Remember:
No new money can enter the simulation.
If the farm doesn’t have sufficient liquid GMT to support OPEX, the cost has to come out of BTC.
That means the miner is effectively selling or sacrificing part of what it mined simply to continue operating.
And that BTC no longer participates in future BTC appreciation.
This creates the hidden cost of building a huge mining engine without building the farm around it.
GoMining TH and GMT Strategy Results: 100% TH Performs Worst
Here is the base case.
I assume that after four years the 12 W/TH miner retains 50% of its original $18.99/TH purchase value, giving it a terminal value of:
$9.495/TH
| TH / GMT | Starting TH | BTC Used for OPEX | OPEX Paid With GMT | Median Wealth |
|---|---|---|---|---|
| 100 / 0 | 526.59 | 0.169 BTC | 0% | $13,747 |
| 90 / 10 | 473.93 | 0.143 BTC | 6.9% | $15,442 |
| 80 / 20 | 421.27 | 0.113 BTC | 17.1% | $17,556 |
| 70 / 30 | 368.62 | 0.082 BTC | 31.3% | $19,684 |
| 60 / 40 | 315.96 | 0.053 BTC | 49.3% | $21,697 |
| 50 / 50 | 263.30 | 0.026 BTC | 72.2% | $23,438 |
| 40 / 60 | 210.64 | 0.005 BTC | 94.6% | $24,876 |
| 30 / 70 | 157.98 | ~0.0003 BTC | 99.5% | $25,471 |
| 20 / 80 | 105.32 | ~0.0002 BTC | 99.5% | $25,335 |
| 10 / 90 | 52.66 | ~0.0001 BTC | 99.5% | $24,826 |
Look at the two extremes in the result.
The 100% TH strategy starts with 526.59 TH.
The 30/70 strategy starts with only 157.98 TH.
Yet median terminal wealth rises from:
$13,747 → $25,471
The important number explaining much of that difference is OPEX.
The 100% TH strategy uses a median:
0.169 BTC for OPEX.
At 30/70:
~0.0003 BTC.
Approximately 99.5% of modeled OPEX is instead funded with GMT.
The 100% TH farm has the biggest army.
But it has almost no support infrastructure behind that army.
Why 100% TH Performs So Poorly
This doesn’t mean TH is bad.
TH is doing exactly what it is supposed to do:
producing Bitcoin.
The problem is that the simulation doesn’t measure gross BTC production.
It measures what you’re left with.
Without GMT support:
More TH → more mining production → more OPEX → more BTC sacrificed to OPEX.
The critical question therefore becomes:
How much of the Bitcoin you mine can you actually keep?
That’s why I think focusing only on TH can be misleading.
A large miner that constantly consumes its BTC to pay operating costs can potentially accumulate less wealth than a smaller but much better-supported farm.
But More GMT Doesn’t Always Win
There is another important result hiding in the table.
If GMT support is so useful, why not put 100% into GMT?
Because GMT isn’t the mining engine.
Look at what happens after 30/70:
30/70 → $25,471
20/80 → $25,335
10/90 → $24,826
Once the farm reaches maximum maintenance discounts and its GMT rewards are already covering nearly all OPEX, additional GMT produces diminishing benefits.
At that point, you’re giving up productive TH without eliminating much additional OPEX.
So the simulation produces a curve.
Too little GMT and the TH becomes expensive to support.
Too much GMT and there isn’t enough TH left producing Bitcoin.
The highest median result happens around the middle of those two forces.
Is 30/70 the Perfect Allocation?
No.
I would not interpret this simulation as saying:
Everyone should invest exactly 30% in TH and 70% in GMT.
The difference between 30/70 and 20/80 is only:
$136
over four years in the base case.
That is far too small relative to the uncertainty in BTC prices, GMT prices, mining difficulty, future rewards and operating costs to claim that 30/70 is a precise universal optimum.
A better interpretation is:
The simulation produces a broad high-performing region around 30/70–20/80 under these assumptions.
The shape of the curve is more important than the exact peak.
What If I Make the Assumptions Much More Favorable to TH?
I also wanted to challenge the result.
Perhaps valuing the miner at only 50% of its purchase price after four years unfairly penalizes TH.
So I ran a second scenario.
Instead of 50%, the miner retains:
75% of its original value.
That gives 12 W/TH a terminal value of:
$14.2425/TH
The median results become:
| TH / GMT | Terminal TH Value | Median Wealth |
|---|---|---|
| 100 / 0 | $7,500 | $16,247 |
| 90 / 10 | $6,750 | $17,692 |
| 80 / 20 | $6,000 | $19,556 |
| 70 / 30 | $5,250 | $21,434 |
| 60 / 40 | $4,500 | $23,197 |
| 50 / 50 | $3,750 | $24,688 |
| 40 / 60 | $3,000 | $25,876 |
| 30 / 70 | $2,250 | $26,221 |
| 20 / 80 | $1,500 | $25,835 |
| 10 / 90 | $750 | $25,076 |
The result survives.
Even after increasing terminal TH value from 50% to 75%, 100% TH remains the lowest median outcome.
And 30/70 remains the median peak.
That makes the central result much more interesting.
The outcome isn’t simply being caused by assuming aggressive TH depreciation.
BTC, GMT and Mining Difficulty Are Not Static
This isn’t a four-year spreadsheet where I simply assume BTC and GMT rise in a straight line.
The Monte Carlo model allows BTC price, GMT price and Bitcoin mining difficulty to fluctuate.
The simulation begins at:
BTC: $84,000
GMT: $0.37
Across the 50,000 simulated paths, the median four-year endpoints are approximately:
BTC: $145,000 (+73%)
GMT: $0.467 (+26%)
These are simulation outputs, not price predictions.
Any smooth BTC and GMT lines shown in the infographic are illustrative smoothened paths between modeled endpoints. They are not actual historical prices or literal weekly Monte Carlo observations.
What Counts as Terminal Wealth?
At the end of four years I calculate:
BTC held + GMT held + residual TH value
This is important because the simulation isn’t merely comparing how much BTC each miner produced.
The locked GMT principal is still an asset.
However, because the model assumes the four-year GMT lock is continually extended to maintain maximum voting power, the locked GMT is still locked at the terminal date.
Terminal wealth should therefore be interpreted as:
Net asset value
rather than:
Immediately available cash.
The Biggest Assumption: Future GMT Rewards
If there is one assumption readers should challenge, it is the modeled GMT reward.
The simulation assumes locked GMT generates an annualized reward fluctuating between:
19% and 23%, averaging approximately 22%.
Actual veGOMINING rewards are not a guaranteed APR.
GoMining states that 20% of newly minted tokens are distributed to veGOMINING holders, with individual rewards depending on the holder’s share of total voting power.
So the 22% average is an economic modeling assumption, not something I am claiming GoMining guarantees for the next four years.
That assumption materially affects the result.
And readers should know that.
What This GoMining TH and GMT Strategy Simulation Actually Shows
The simulation doesn’t show that GMT is better than TH.
And it definitely doesn’t show that TH is useless.
It shows something more useful.
TH is the productive asset.
Without TH, there is no BTC mining engine.
But TH also creates an operating liability.
GMT can support that liability through maintenance discounts, VIP status and liquid rewards.
The relationship therefore looks something like this:
Too little farm support → BTC gets consumed by OPEX.
Enough farm support → more BTC can remain accumulated.
Too much farm support → too little TH remains productive.
That’s why the curve eventually peaks.
Build the Farm
The lesson I take from this isn’t:
Buy GMT instead of TH.
It is:
Build the Farm.
TH is your army.
GMT is part of the infrastructure supporting that army.
If you build nothing but soldiers, eventually you have to spend your resources keeping the army alive.
If you build nothing but infrastructure, you have no army.
The objective is to build enough infrastructure to support productive TH—and then continue expanding from a stronger base.
In this experiment, the biggest mining engine started with 526.59 TH.
It also finished with the lowest median wealth.
That’s why I no longer think the right question is:
How much TH can I buy?
The better question is:
How much TH can my farm sustainably support?
TH is king.
But even a king needs a kingdom.
Disclaimer: This article describes a Monte Carlo simulation based on assumptions about BTC price, GMT price, Bitcoin mining difficulty, locked-GMT rewards, maintenance costs, discounts and terminal miner value. Simulation results are not forecasts or guaranteed returns. This article is for research and educational purposes and is not financial advice.
Leave a Reply